
North Metro Regional Economic Indicators Dashboard
September 2026
The Anoka County Economy
This dashboard was developed as a resource for the MetroNorth community that consolidates economic and demographic trends across Anoka County. The dashboard is intended to support businesses, policymakers, and community stakeholders by presenting data-driven insights into the region’s indicators. Through research utilizing state and federal datasets and a chamber-wide survey, this dashboard includes key county- and city-level indicators that highlight the strengths, trends, and opportunities in the North Metro economy.
Note: Benchmarks against MSP counties or Twin Cities metropolitan counties refer to the 7-County Twin Cities Metropolitan Area, which is comprised of Anoka, Carver, Dakota, Hennepin, Ramsey, Scott, and Washington counties.

Employment & Workforce
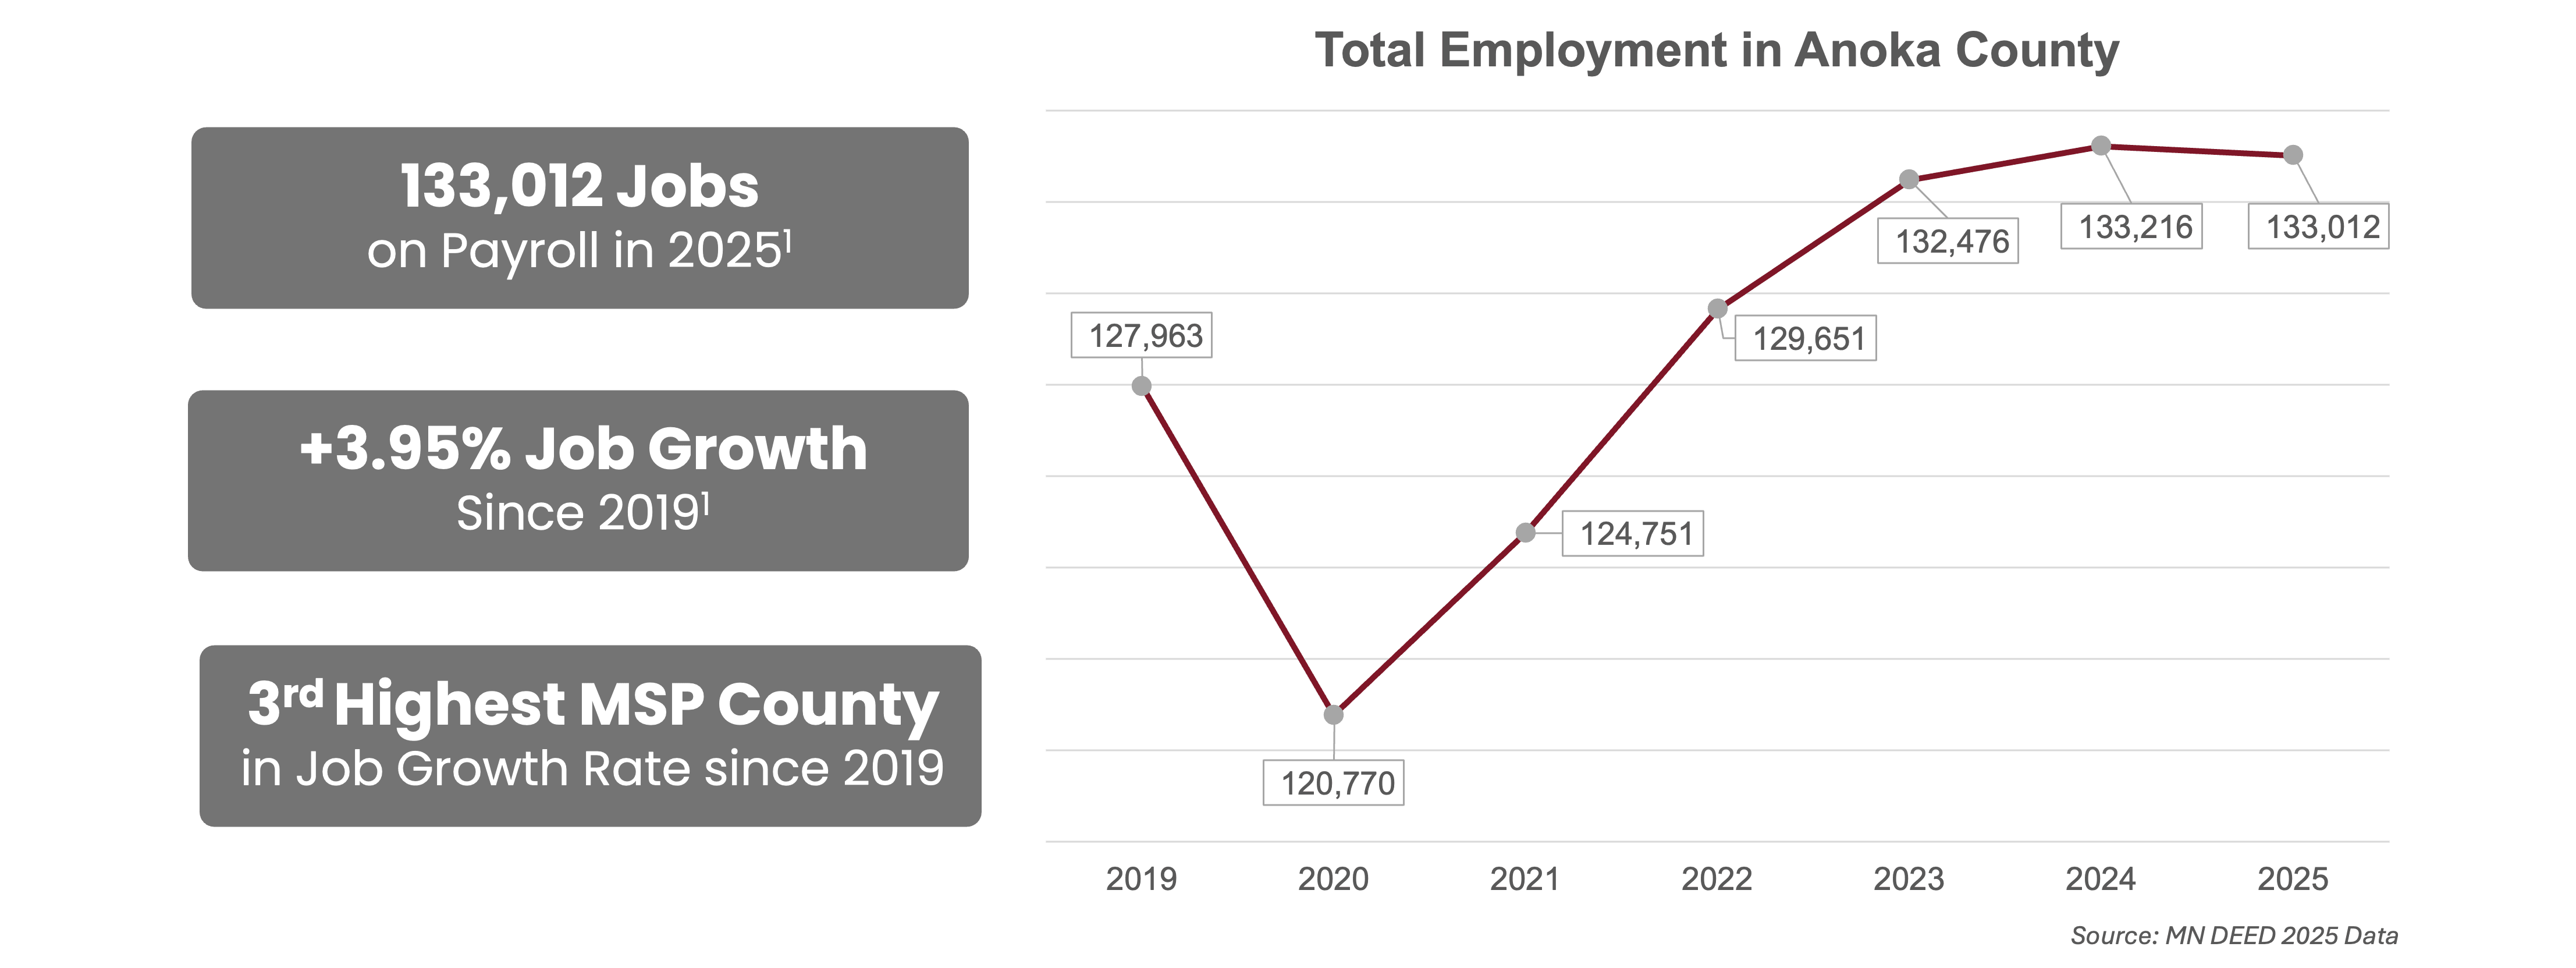
Employment in Anoka County has recovered to above pre-pandemic levels, from 127,963 jobs in 2019 to 133,012 in 2025. The county’s nearly 4% job growth since 2019 ranks 3rd among Twin Cities metropolitan counties.
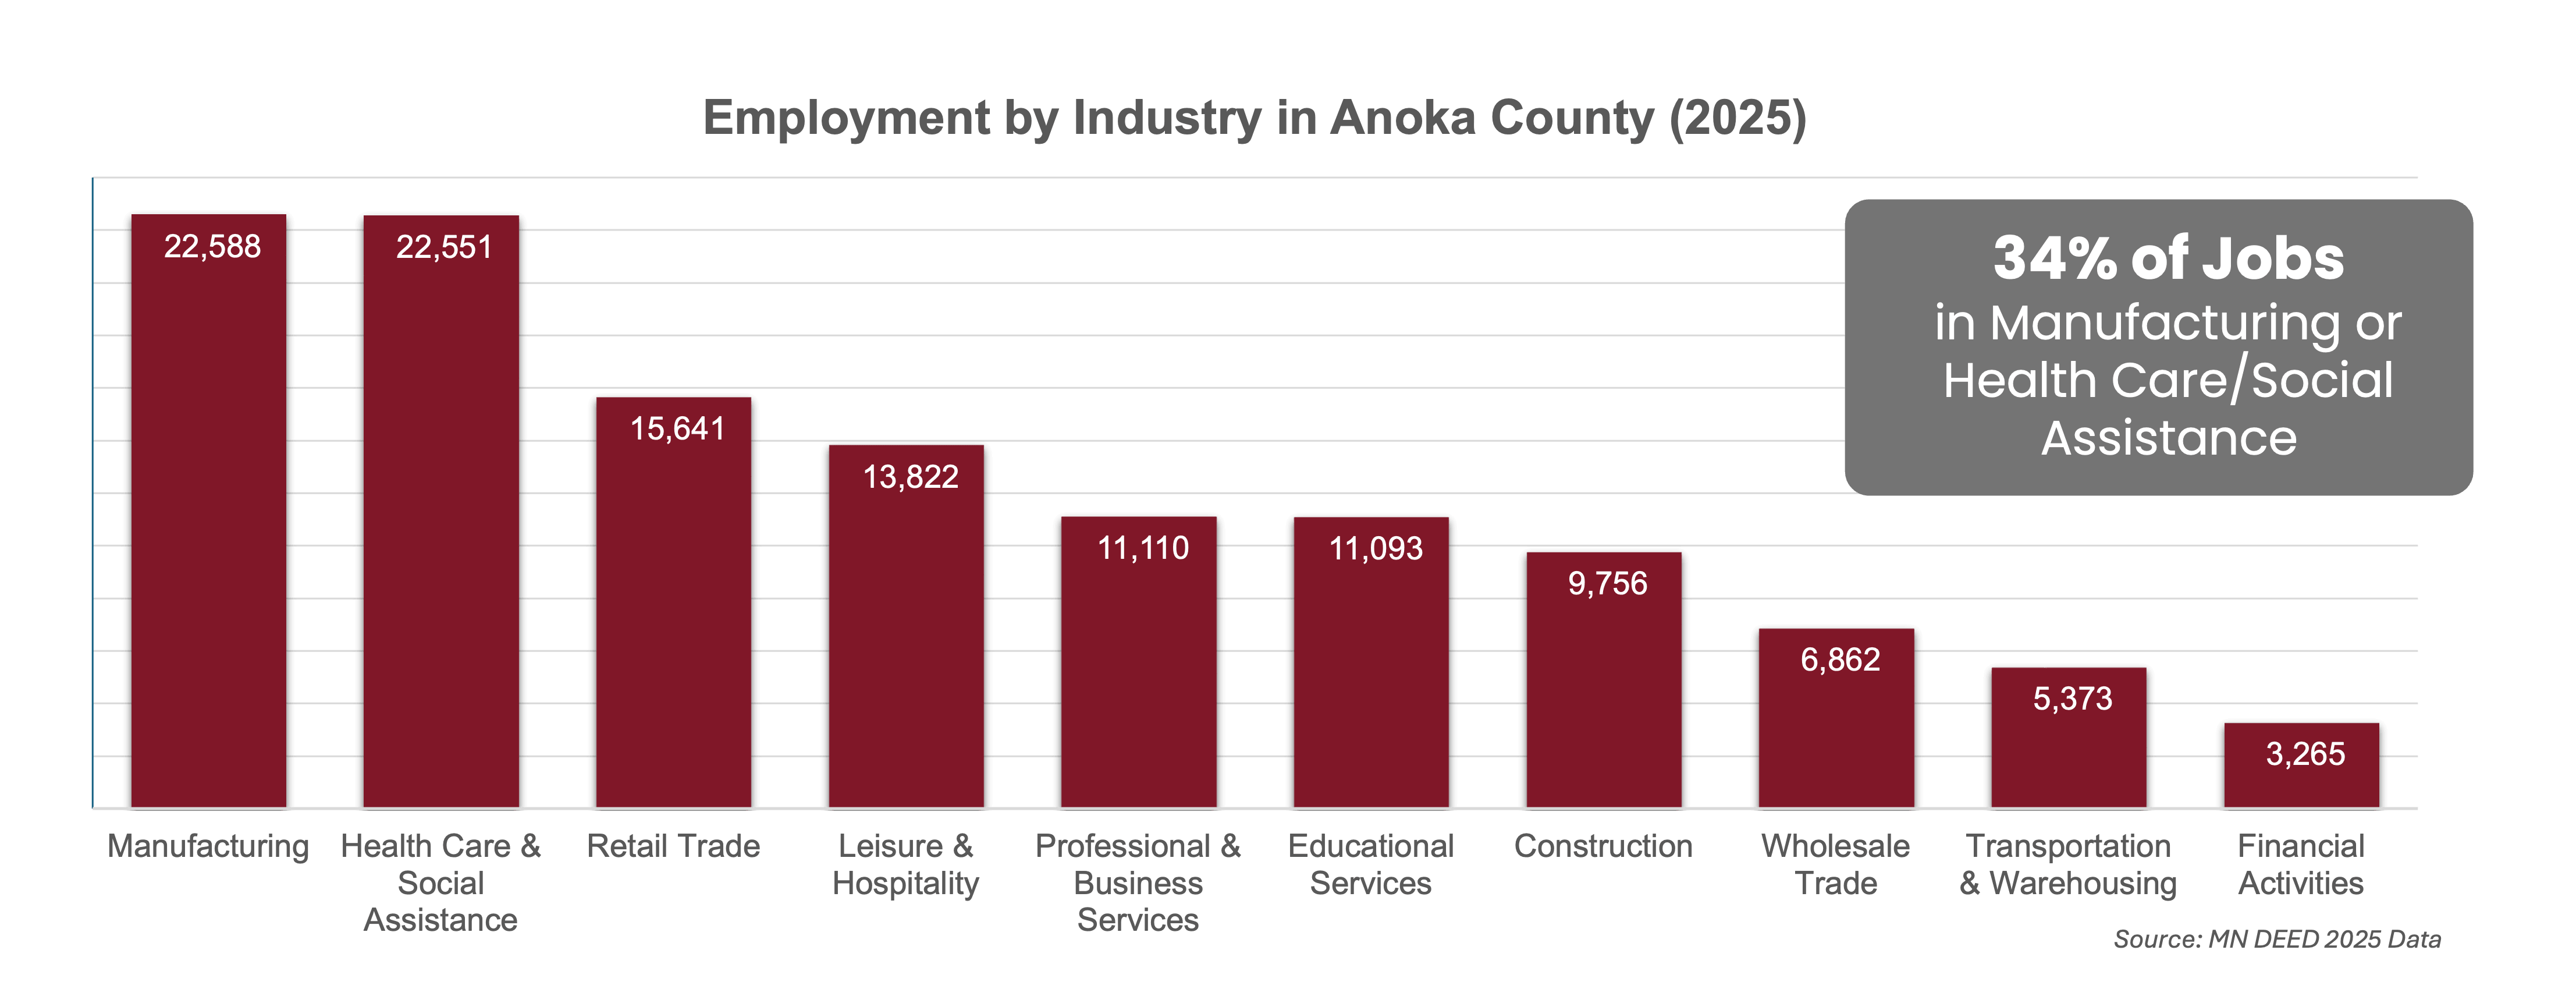
Manufacturing and Health Care/Social Assistance industries are the largest employer sectors, with approximately 17% of total jobs in each sector, together accounting for 34% of the county’s total jobs.

Anoka County has a high labor force participation rate at nearly 85%, with approximately 190,096 individuals in the labor force. The county's unemployment rate is 4.1%, which is on par with the Minnesota statewide rate, but the highest among Twin Cities metropolitan counties.
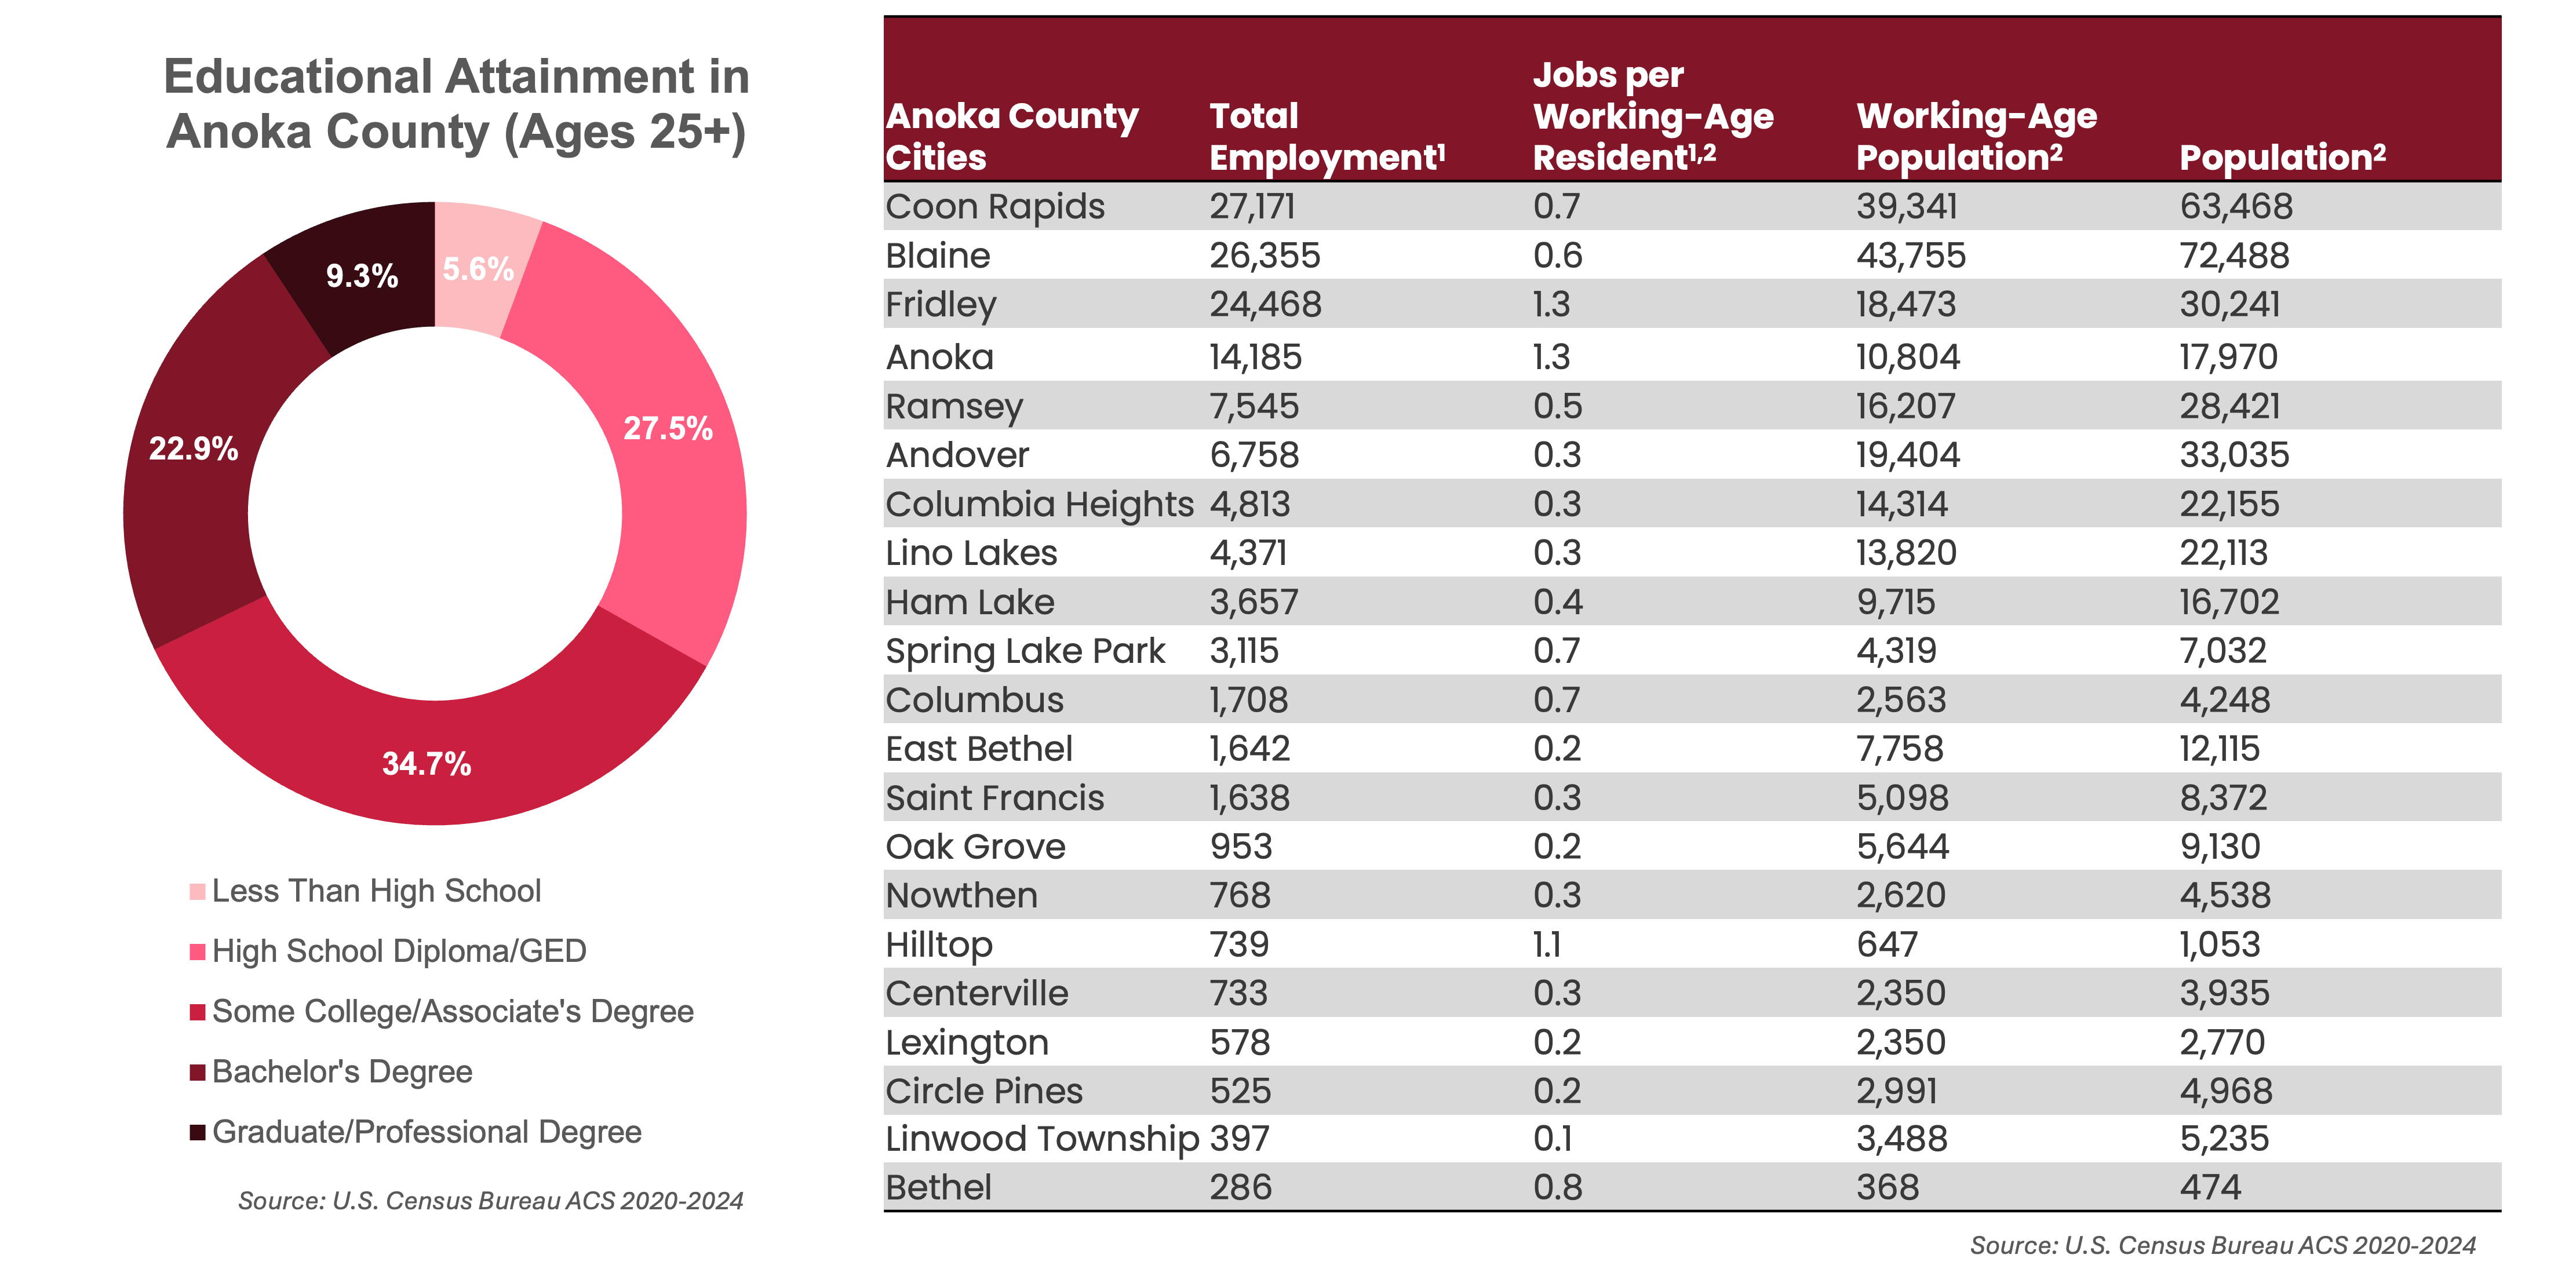
About 94% of Anoka County residents aged 25 or older have at least a high school diploma/GED education, with the largest educational attainment groups being Some College/Associate's Degree (34.7%), High School Diploma/GED (27.5%), and Bachelor's Degree (22.9%).
Some cities in Anoka County have a larger Jobs per Working-Age Resident ratio than others, with ratios ranging from 0.1 to 1.3 Jobs per Working-Age resident. Fridley, Anoka, and Hilltop are the only cities with more jobs than their working-age population (ratios greater than 1.0), while the rest of the Anoka County cities have fewer jobs than their working-age population (ratios less than 1.0), suggesting more suburban-centered neighborhoods than commercial areas.

61.3% of jobs in Anoka County are filled by out-of-county residents, reflecting the county’s reliance on workers from neighboring regions. Conversely, most Anoka County residents (73.1%) work outside the county. Anoka County also provides free career services and training for its residents through its CareerForce Lab located in Blaine, which received 7,691 visits in 2025.
Demographics
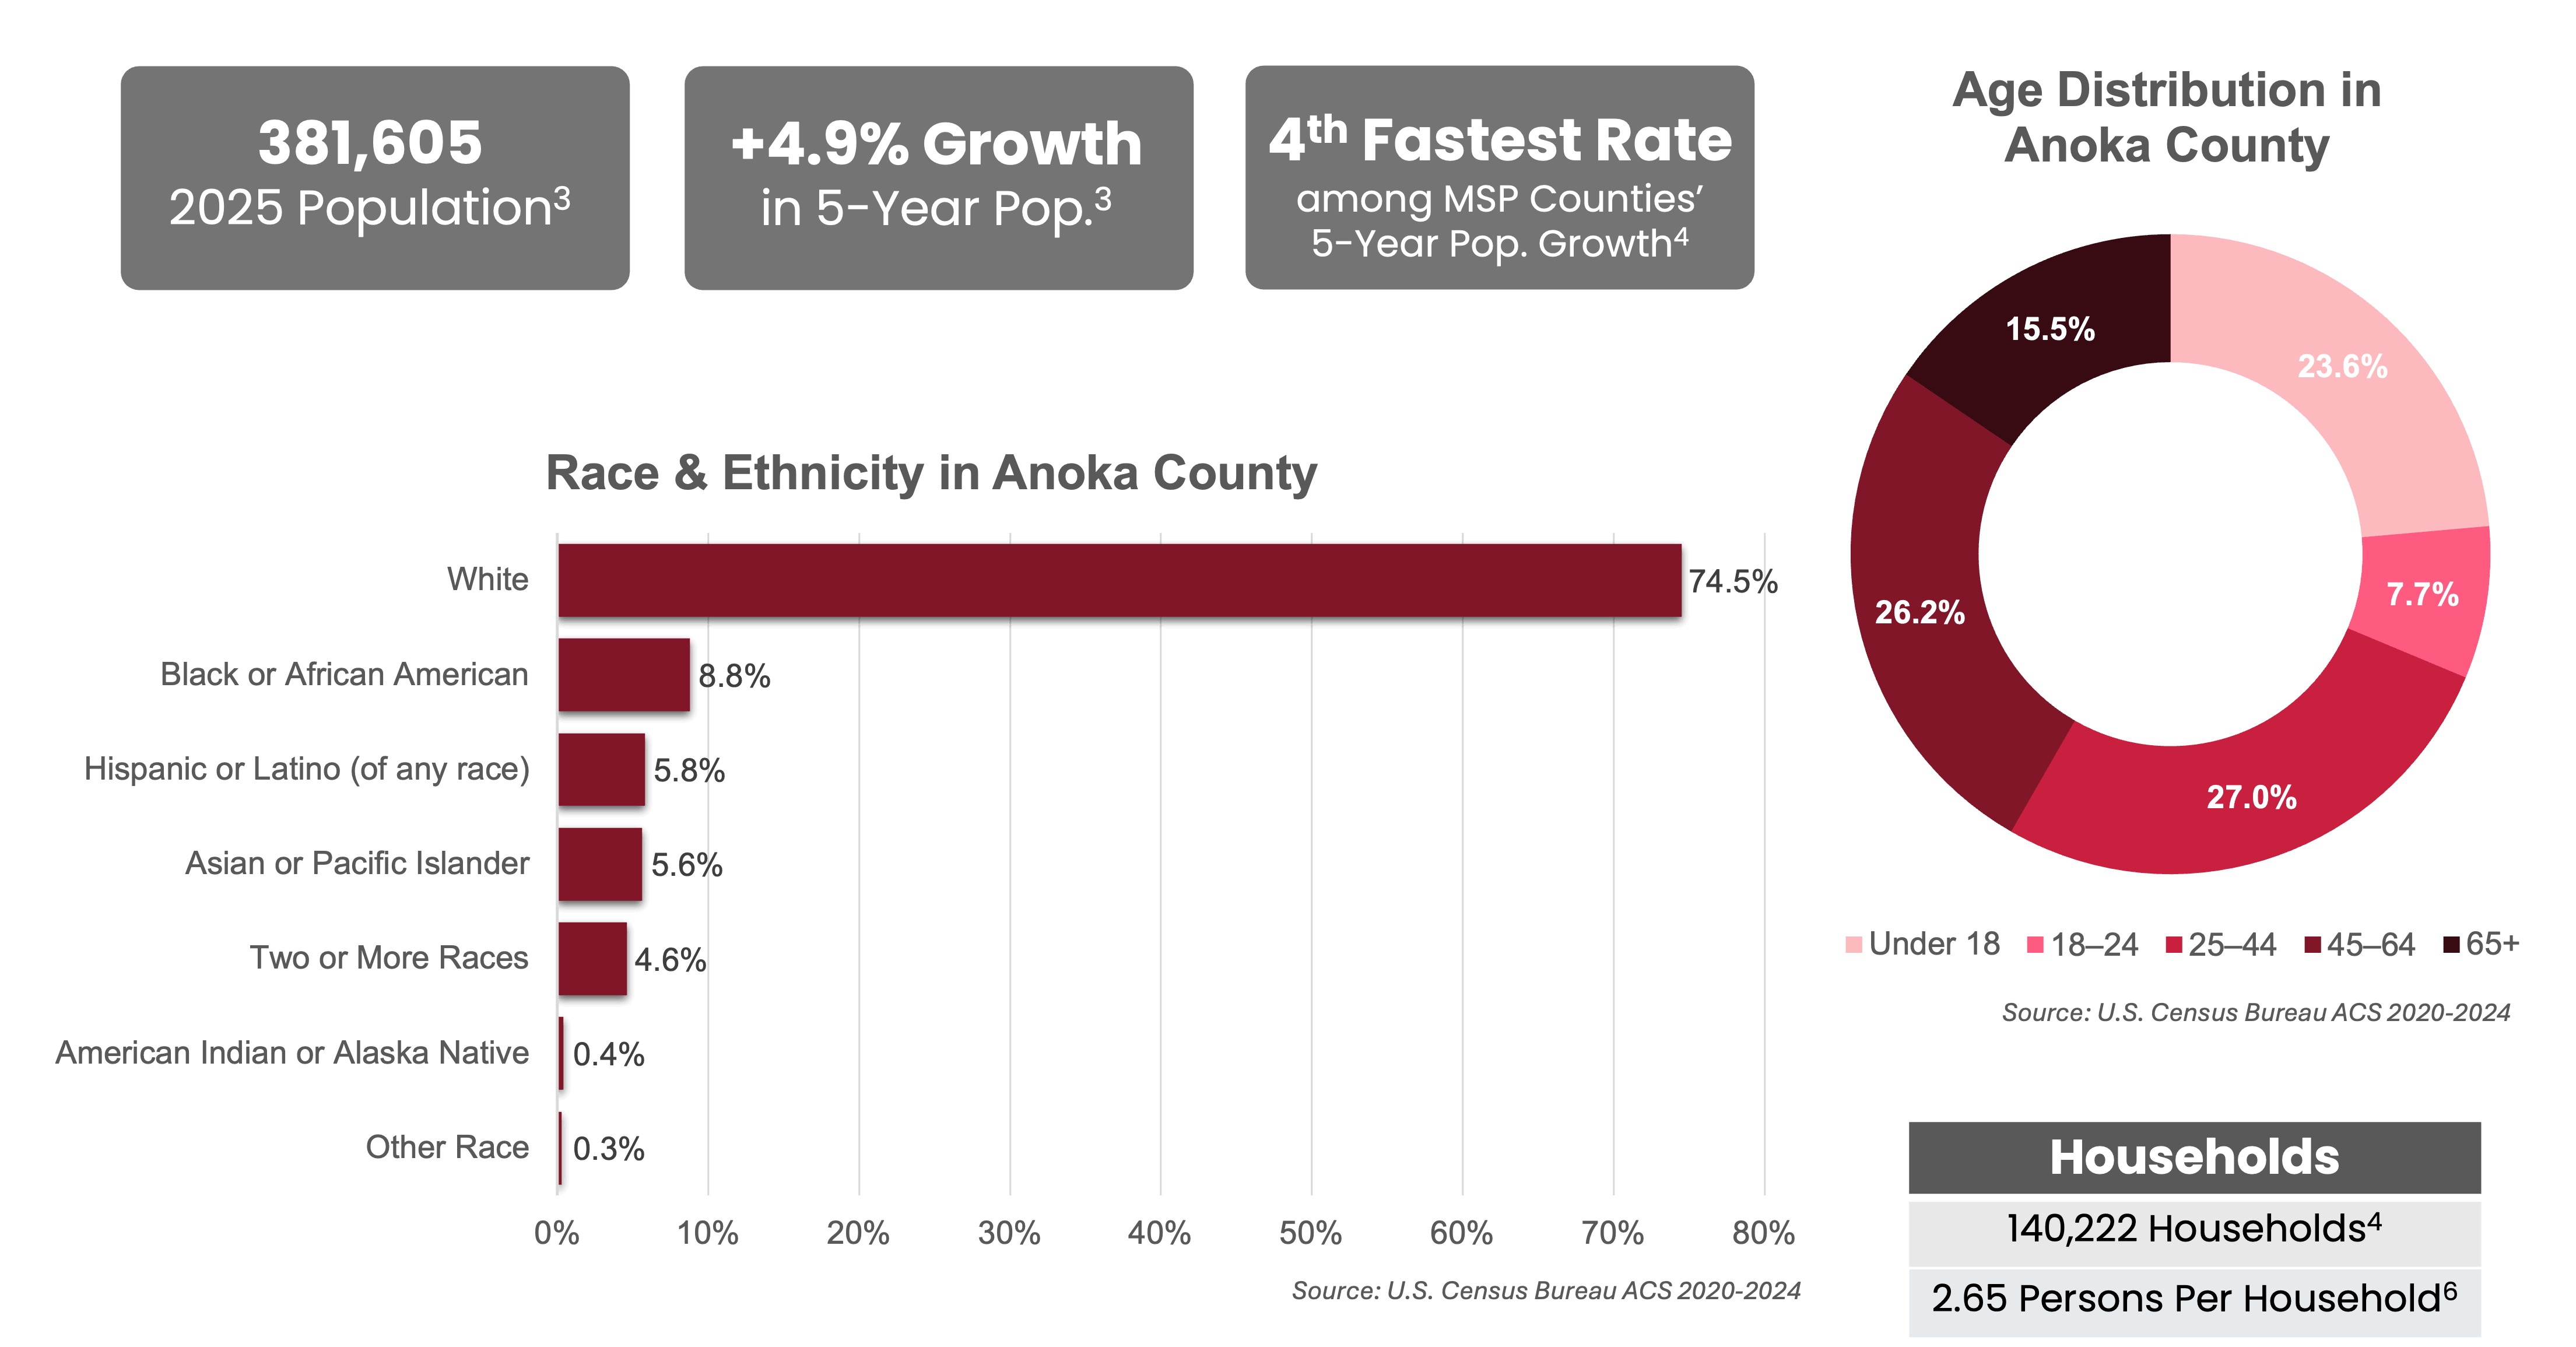
Anoka County had about 364,000 residents in 2020 and 382,000 in 2025. This 4.9% five-year population growth rate ranks 4th among Twin Cities metropolitan counties and is 1.7 percentage points higher than the statewide rate. More than 60% of the population is between the ages of 18 and 64, reflecting a large working-age population in the county.
Anoka County predominantly consists of multi-person households, with an average of 2.65 persons per household. The county also consists of a mostly White population, with increasing representation of other racial and ethnic groups.

In 2025, Anoka County's median household income was $101,869, while per capita income (average income per resident) was roughly $45,500. The county's per capita income ranks the lowest among the Twin Cities metropolitan counties, although its per capita income experienced a 4.07% increase from 2024 to 2025.
Business Vitality
The MetroNorth Business Conditions Survey (conducted in August 2026) was designed to capture the business trends of the North Metro community, with responses published anonymously to capture economic sentiment. Despite not being fully representative of the North Metro region, the survey’s 51 chamber member responses provide useful insight into local business conditions for this dashboard's Business Vitality section, as indicated by the charts' Survey Results labels. A summary of the survey results is also listed at the bottom of this dashboard.
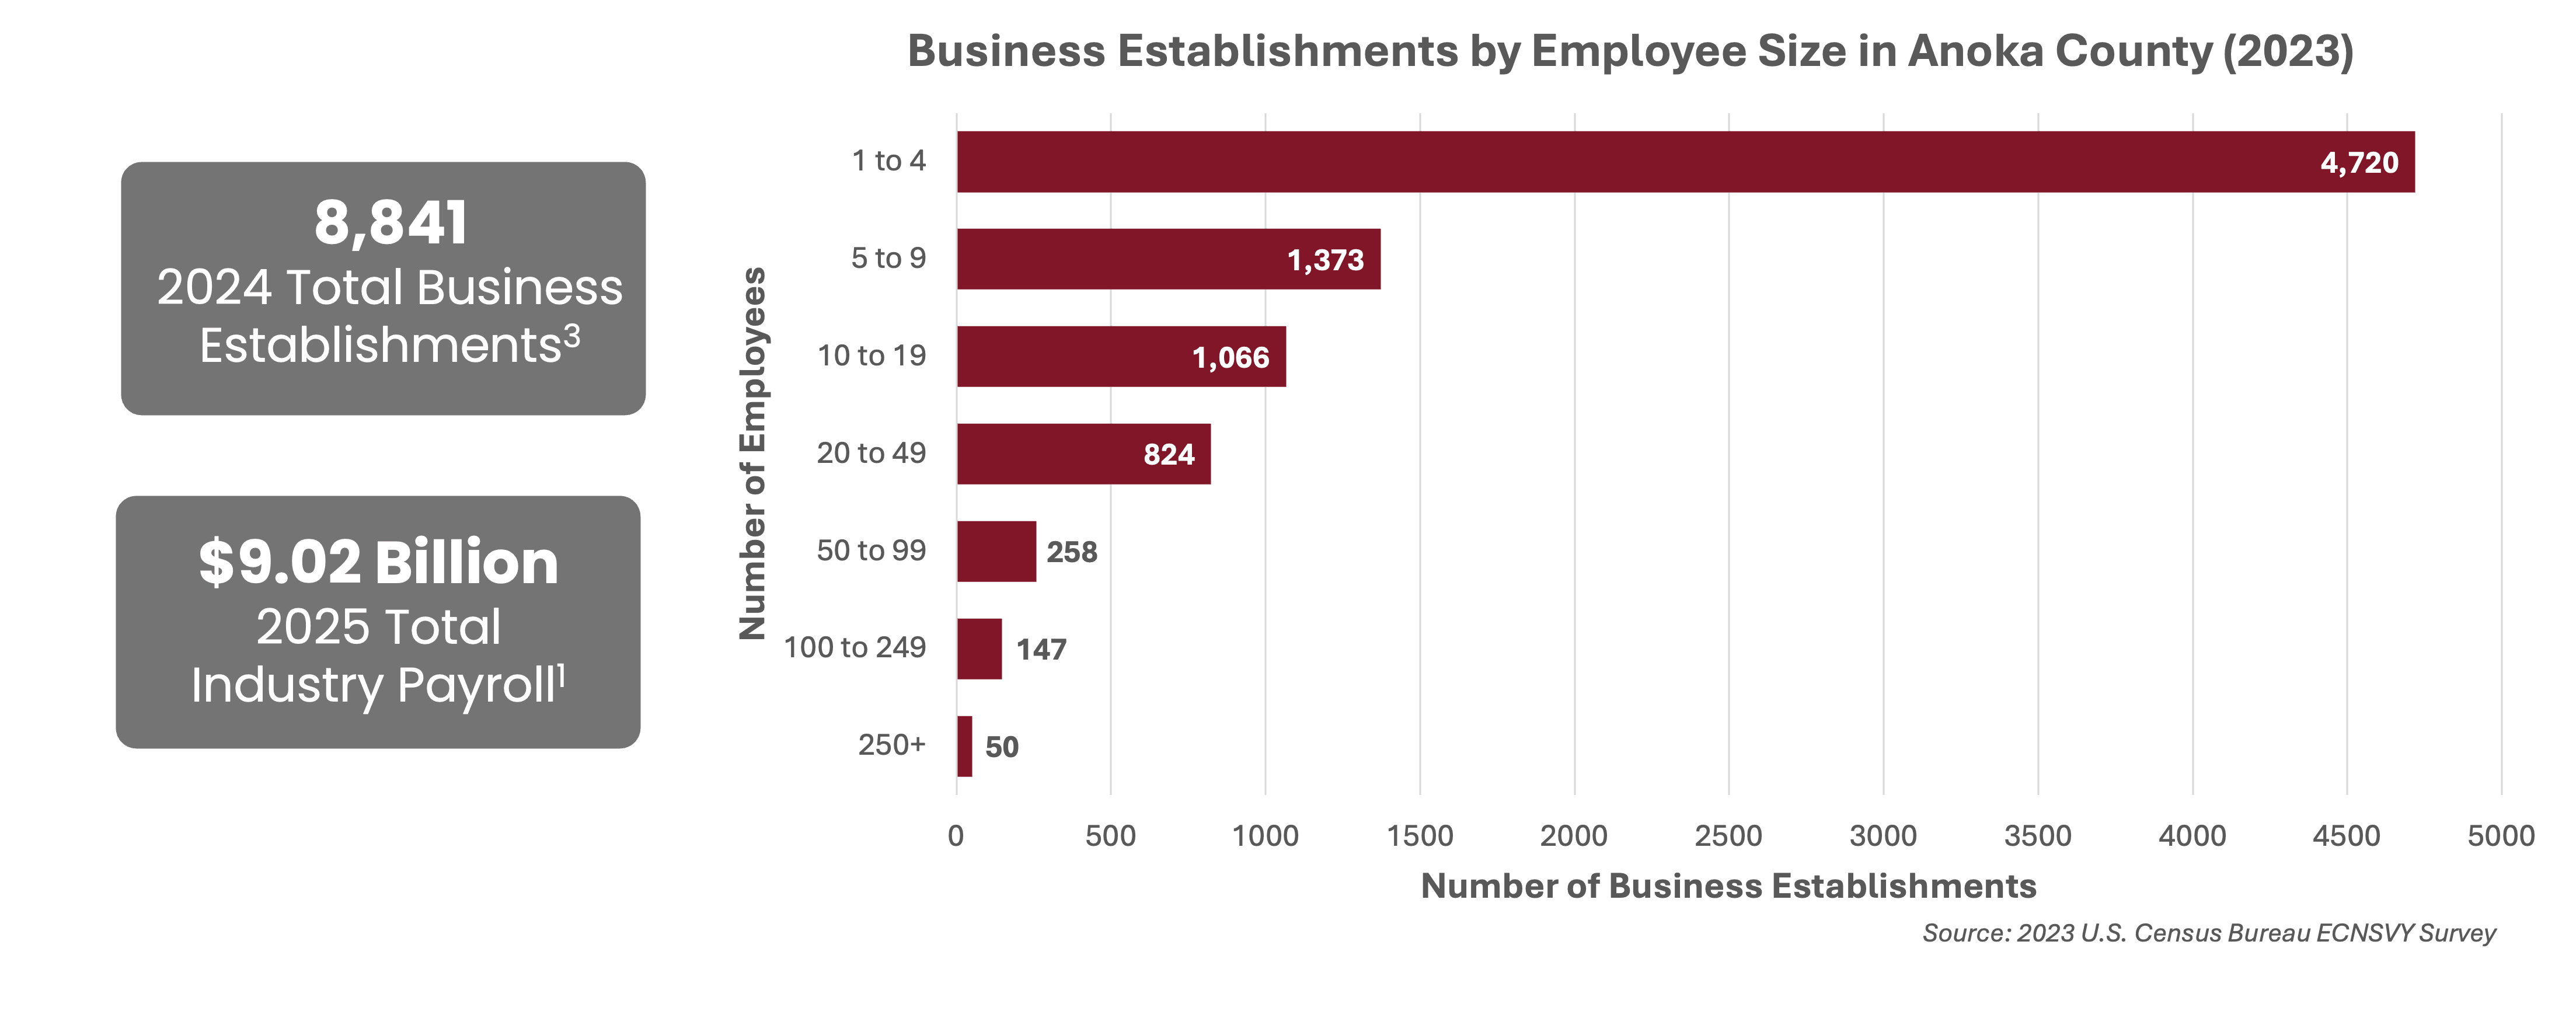
Most business establishments in Anoka County are small businesses: about 56% employ fewer than 5 employees and 72% employ fewer than 10 employees. Anoka County's Real GDP was $15.75 billion in 2024, and its total 2025 industry payroll was about $9.02 billion, ranking 4th among Twin Cities metropolitan counties in both statistics.

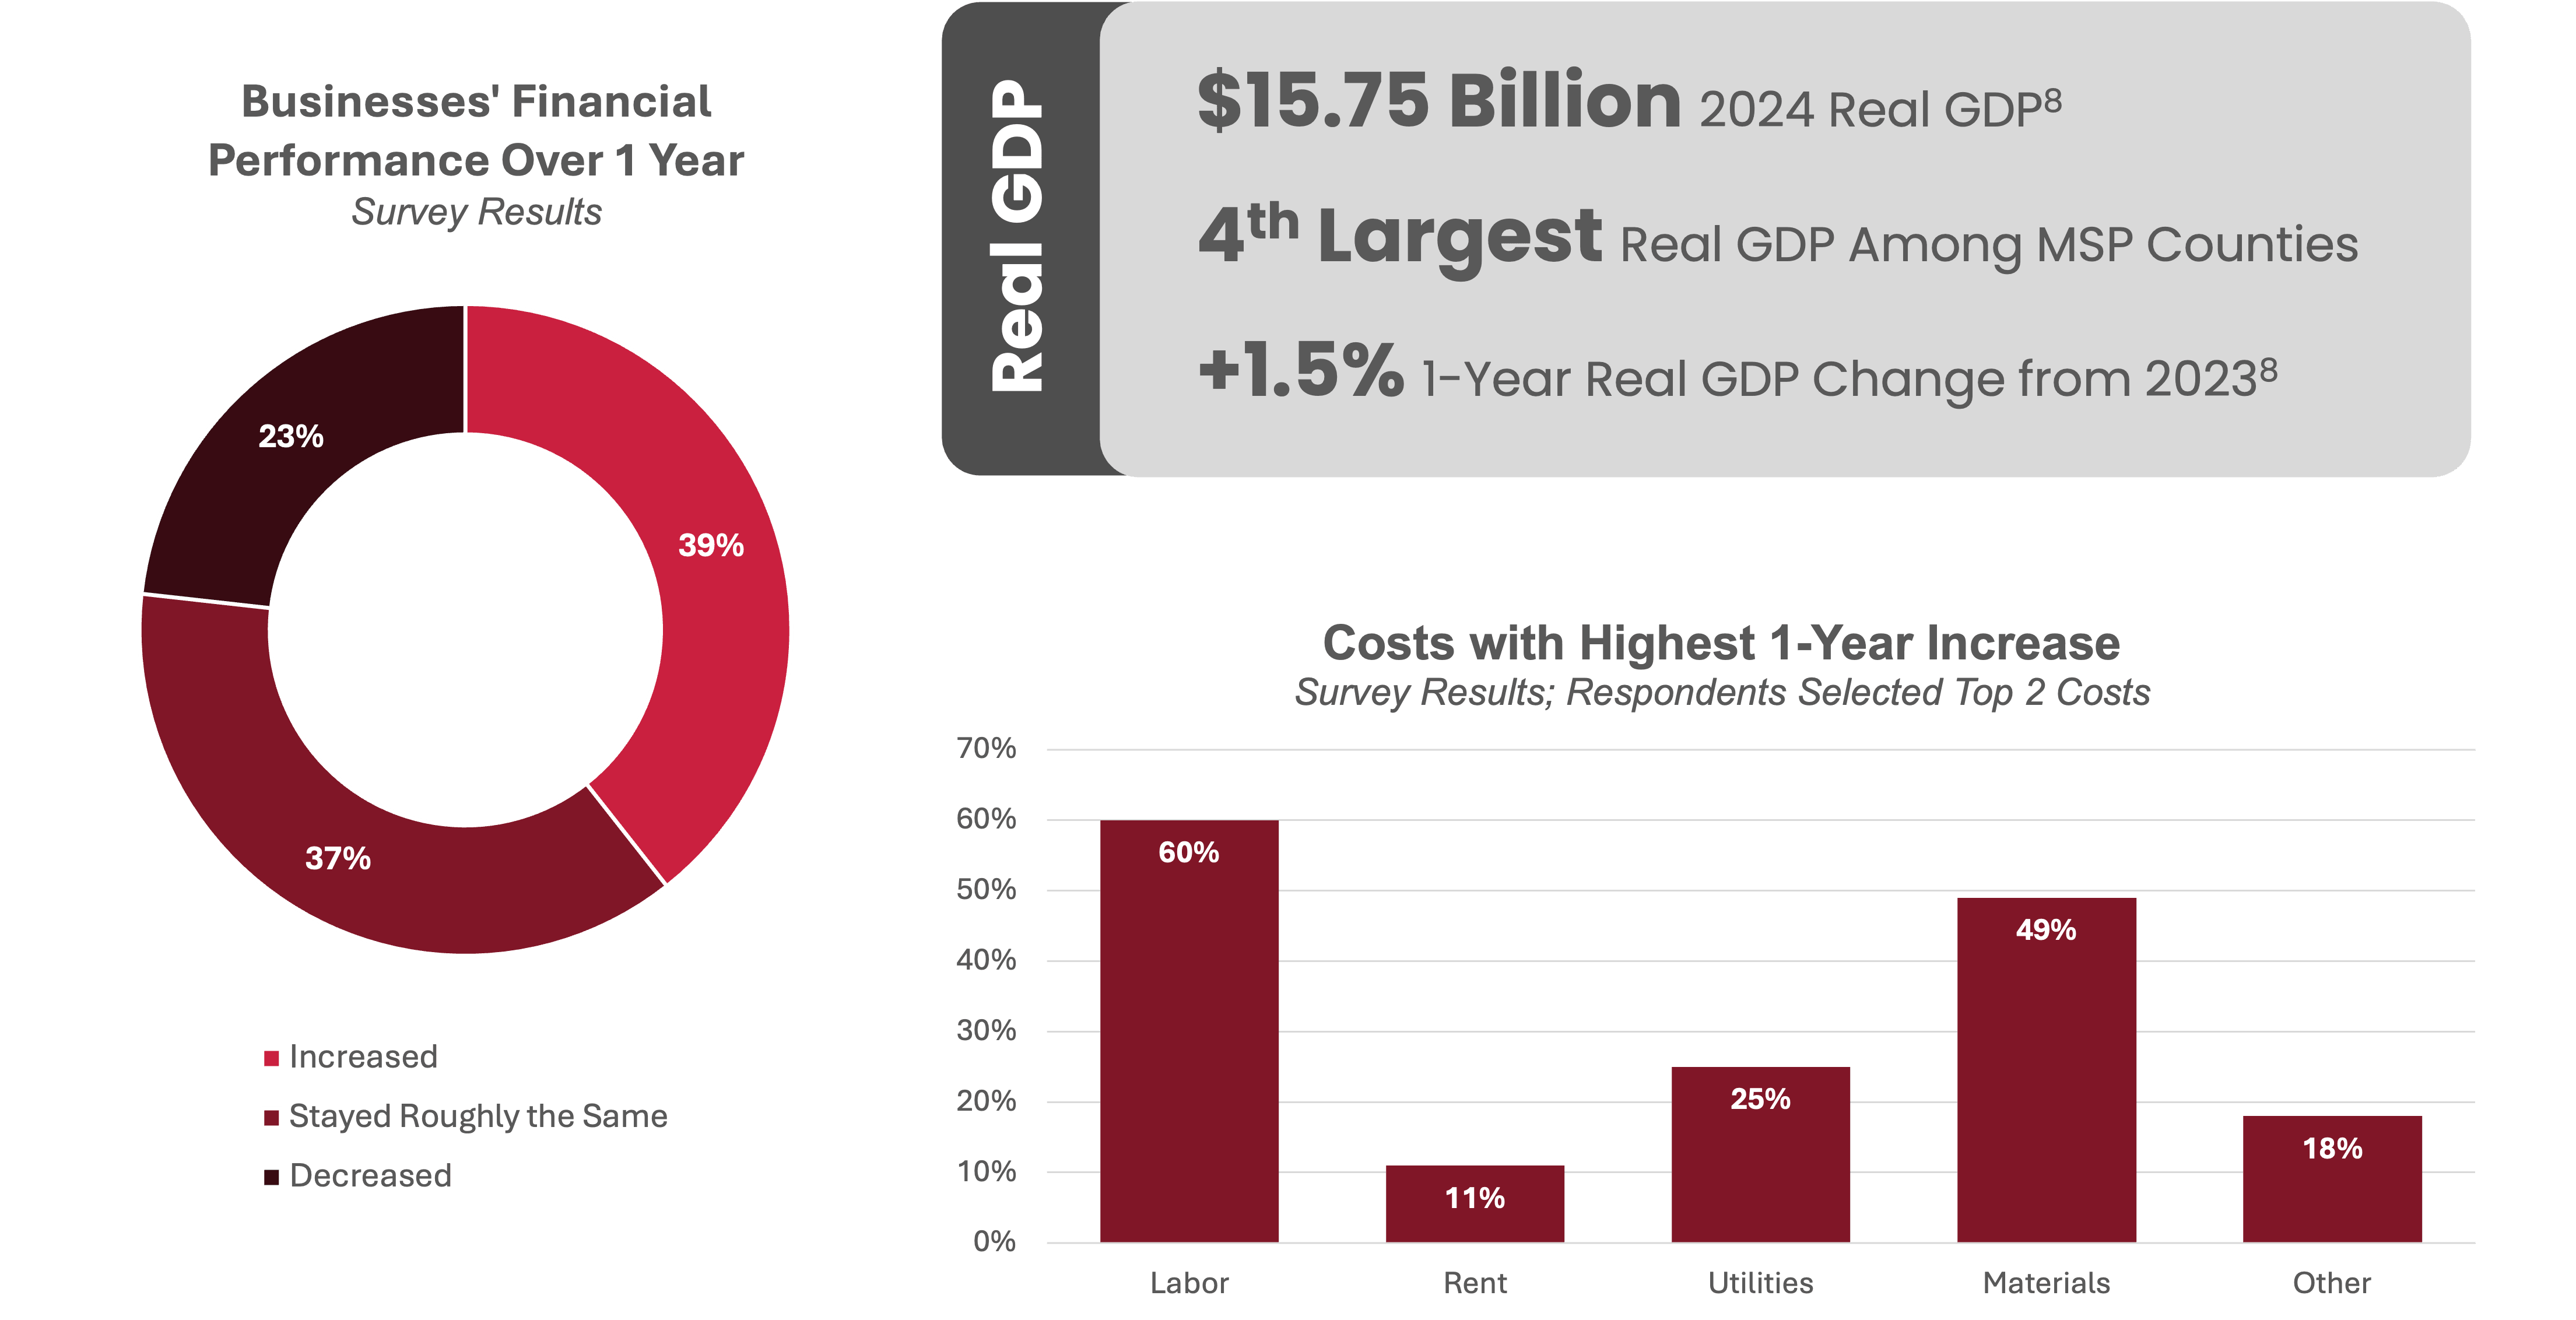
Respondents to MetroNorth's Business Conditions Survey were asked whether their business’s financial performance increased, decreased, or stayed roughly the same compared to one year ago. 39% of respondents reported an increase and 37% reported a similar performance to one year ago—with only 23% reporting a decrease.
When asked about their business's top two costs that have increased the most in the past year, Labor (60%) and Materials (49%) were the most selected top costs.
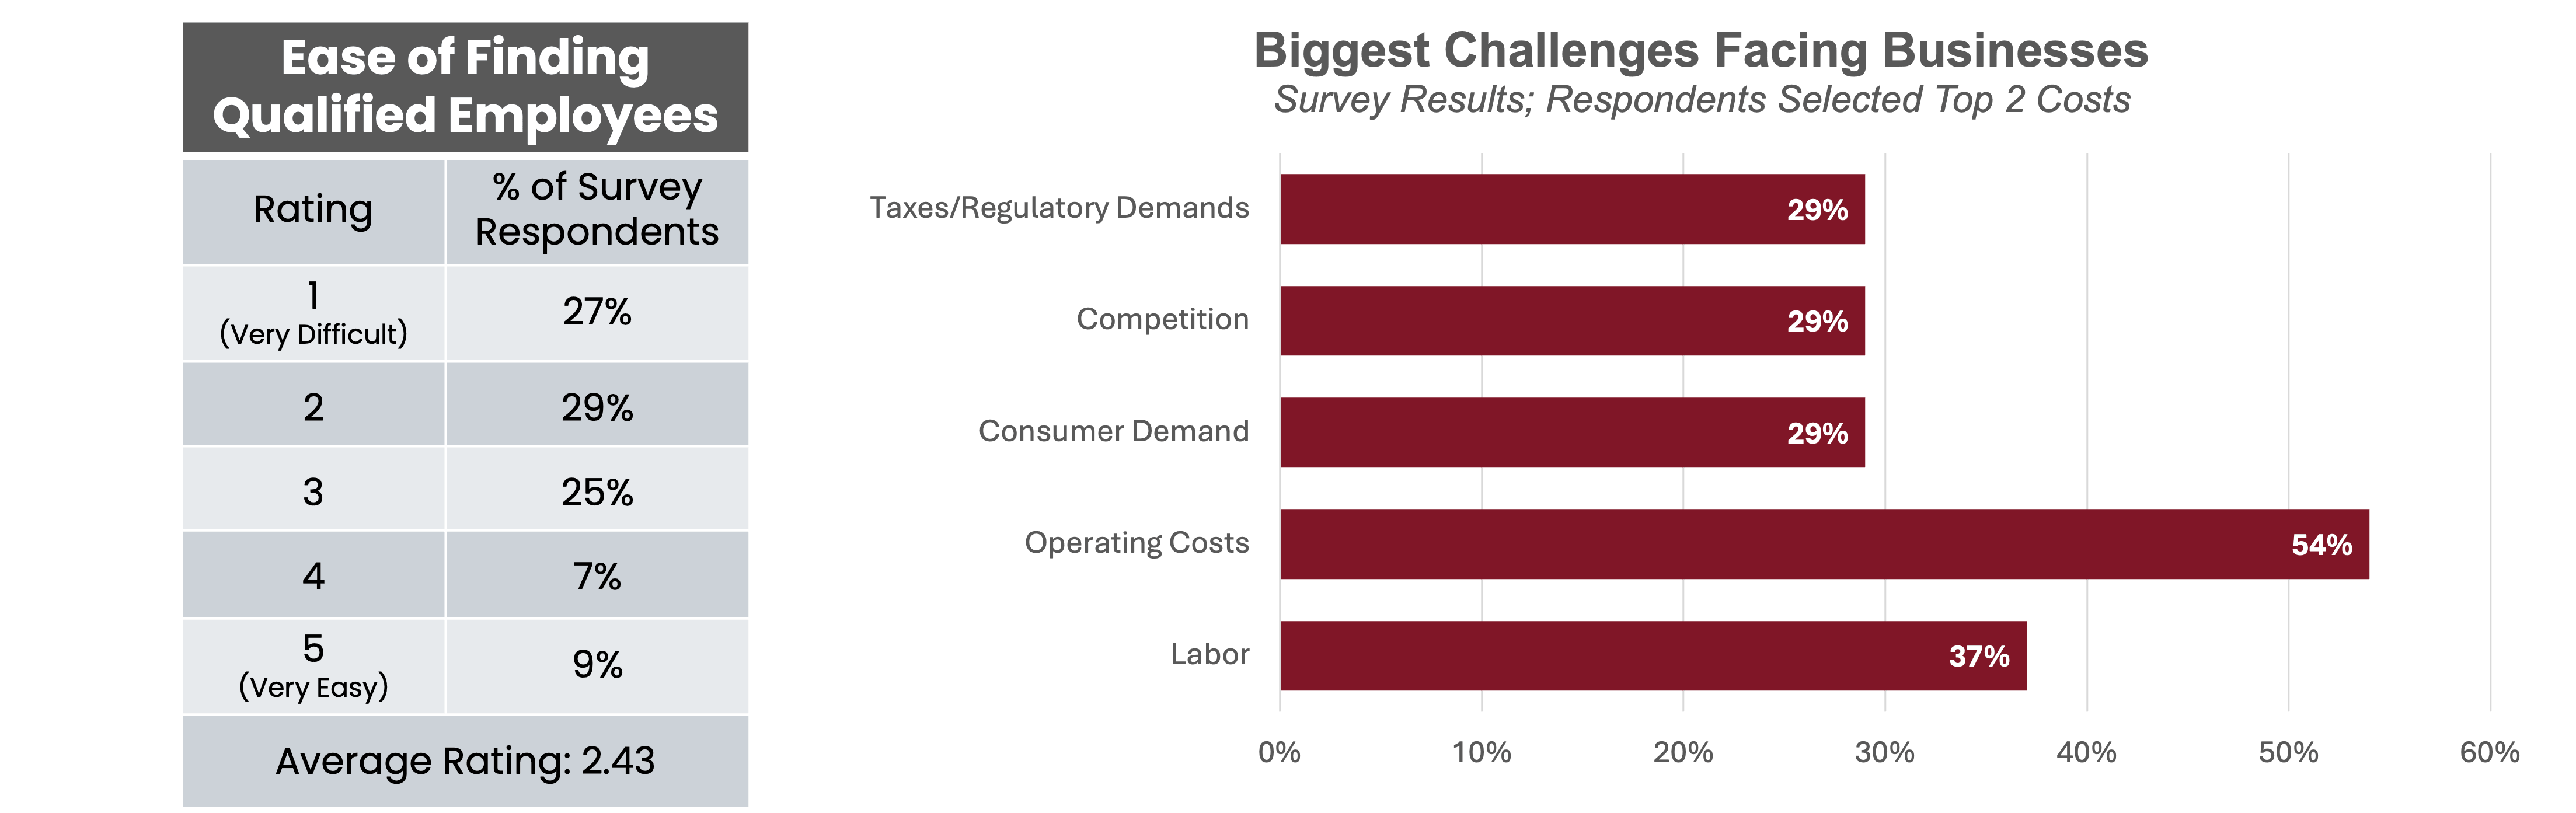
Survey respondents ranked their ease of finding qualified employees on a scale of 1 (Very Difficult) to 5 (Very Easy). Respondents' average rating was 2.43, with approximately 56% of respondents selecting a rating below 3 (indicating difficulty in hiring), 16% of respondents selecting over 3 (indicating ease in hiring), and 25% selecting a 3 (moderate hiring processes).
When asked about the top two biggest challenges facing their businesses, respondents' most reported challenges were Operating Costs (54%) and Labor (37%).
Housing & Cost of Living
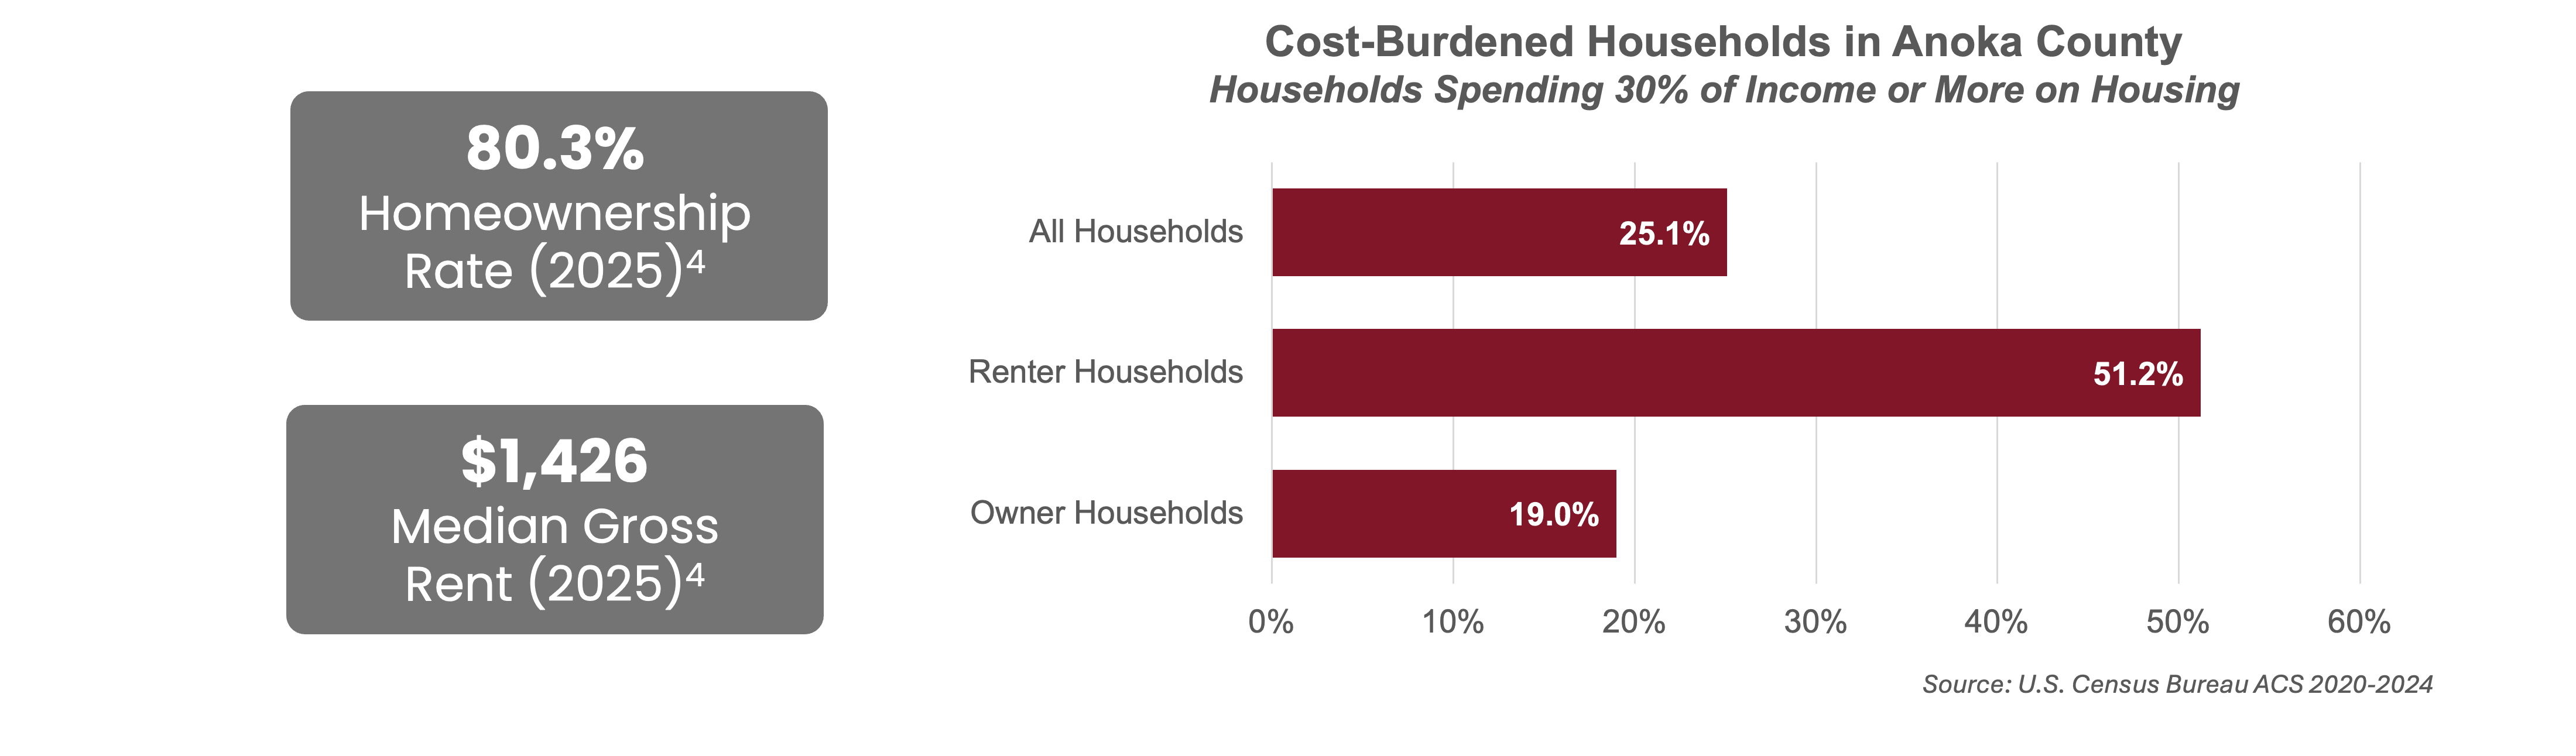
80.3% of Anoka County households are homeowners, with the remaining 19.7% of households renting their homes. 51.2% of Anoka County renter households spend 30% or more of their household income on rent, while 19% of homeowner households spend 30% or more of their household income on housing costs, highlighting housing affordability challenges that disproportionately affect renters in the county.

The median household income in Anoka County of $101,869 falls slightly short of the annual income required for the median home ($103,950 required for a median owner-occupied home value of $346,500, which reflects homes purchased at various points over the years rather than current market prices). However, the median household income is well over the annual income required for a rental home ($58,560 for a median rent of $1,426). With a median home asking price of $439,193 in 2025, homes were seeing a median of 38 days on the market.
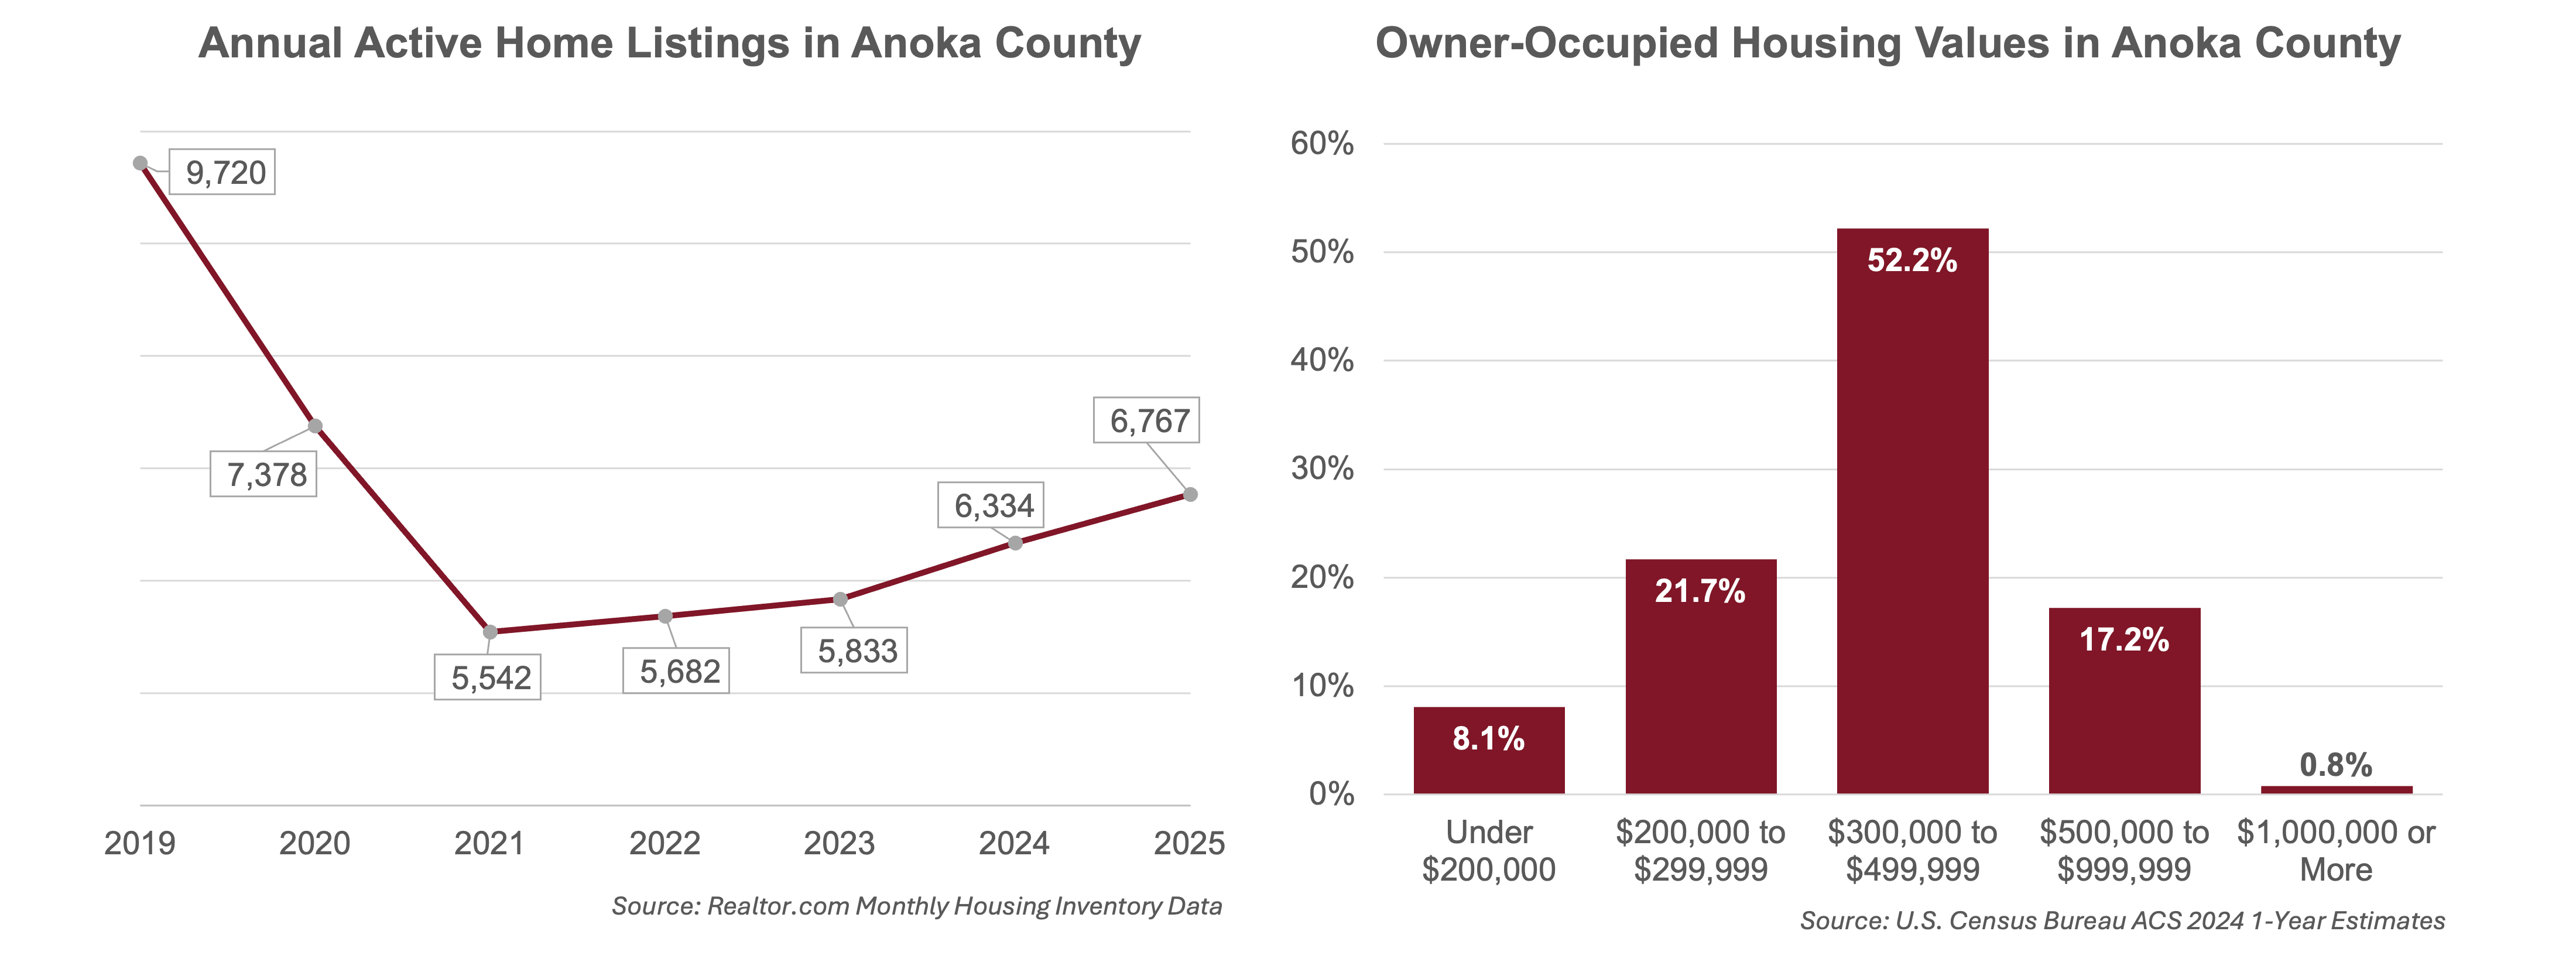
Annual active home listings in Anoka County have not recovered since the COVID-19 pandemic, with 9,720 listings in 2019 and 6,767 in 2025. The lowest recorded annual active home listing total was in 2021, and it has been steadily rising since.
Anoka County's owner-occupied housing values are mostly concentrated between $300,000 and $499,999, with 52.2% of these home values falling in this range. Over 91% of owner-occupied housing values are between $200,000 and $999,999.
Infrastructure & Accessibility
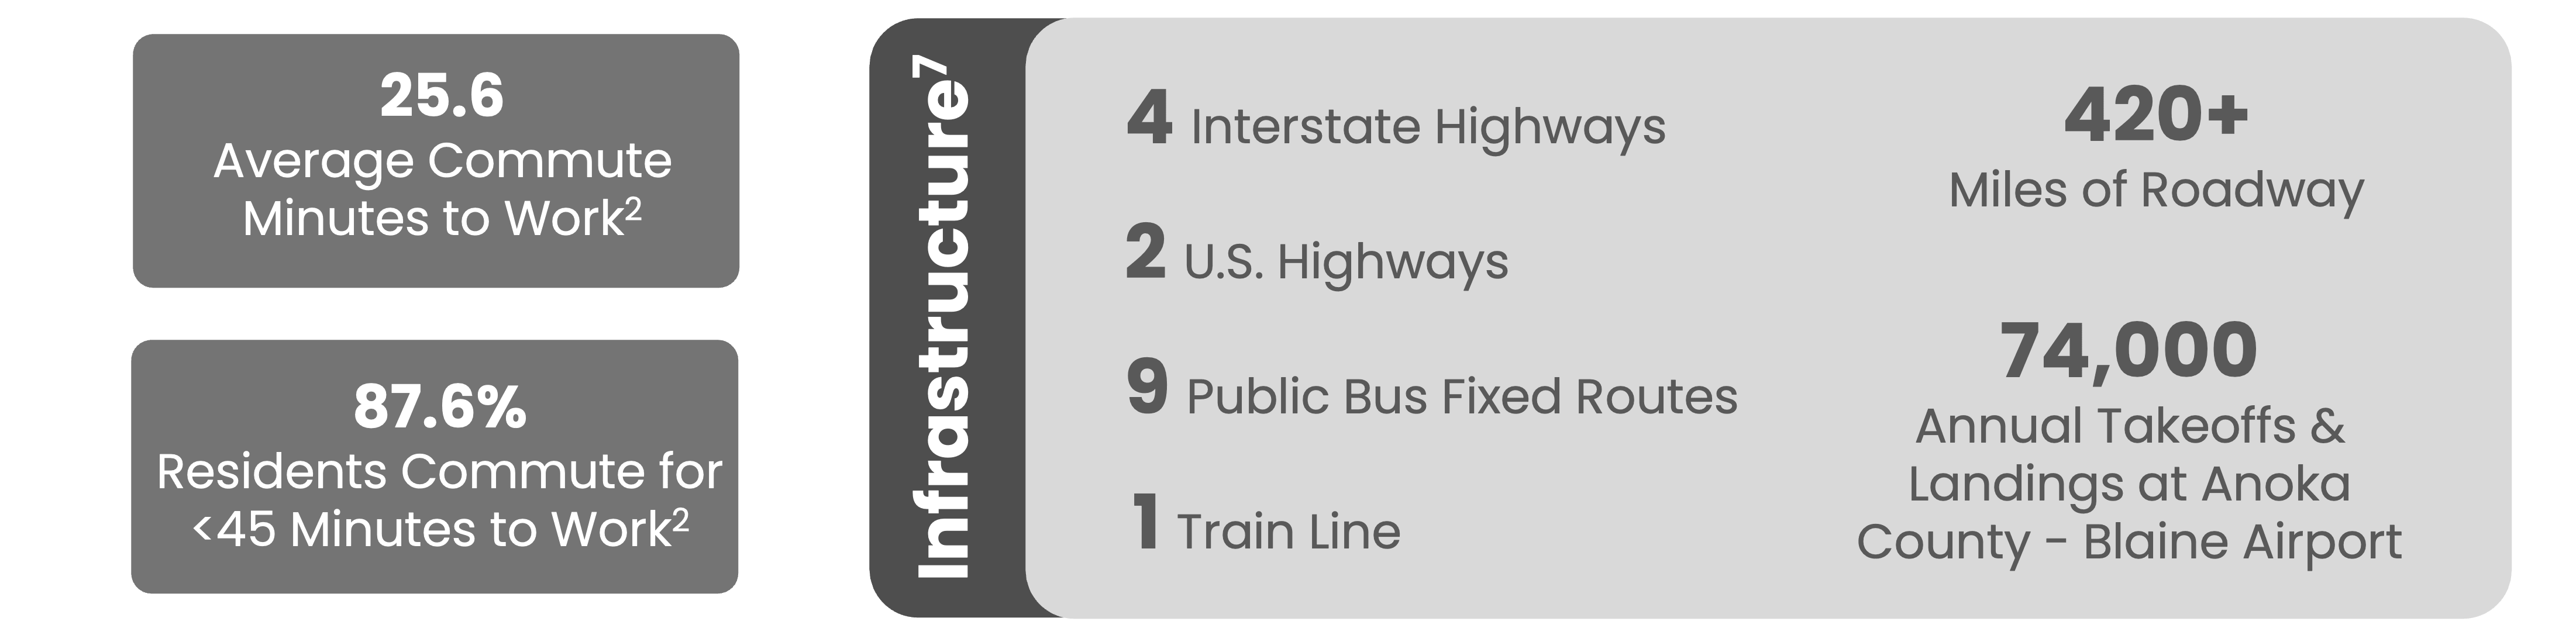
87.6% of Anoka County residents commute less than 45 minutes to work, with an average commute time of 25.6 minutes, highlighting residents’ accessibility to employment opportunities in and near the region.
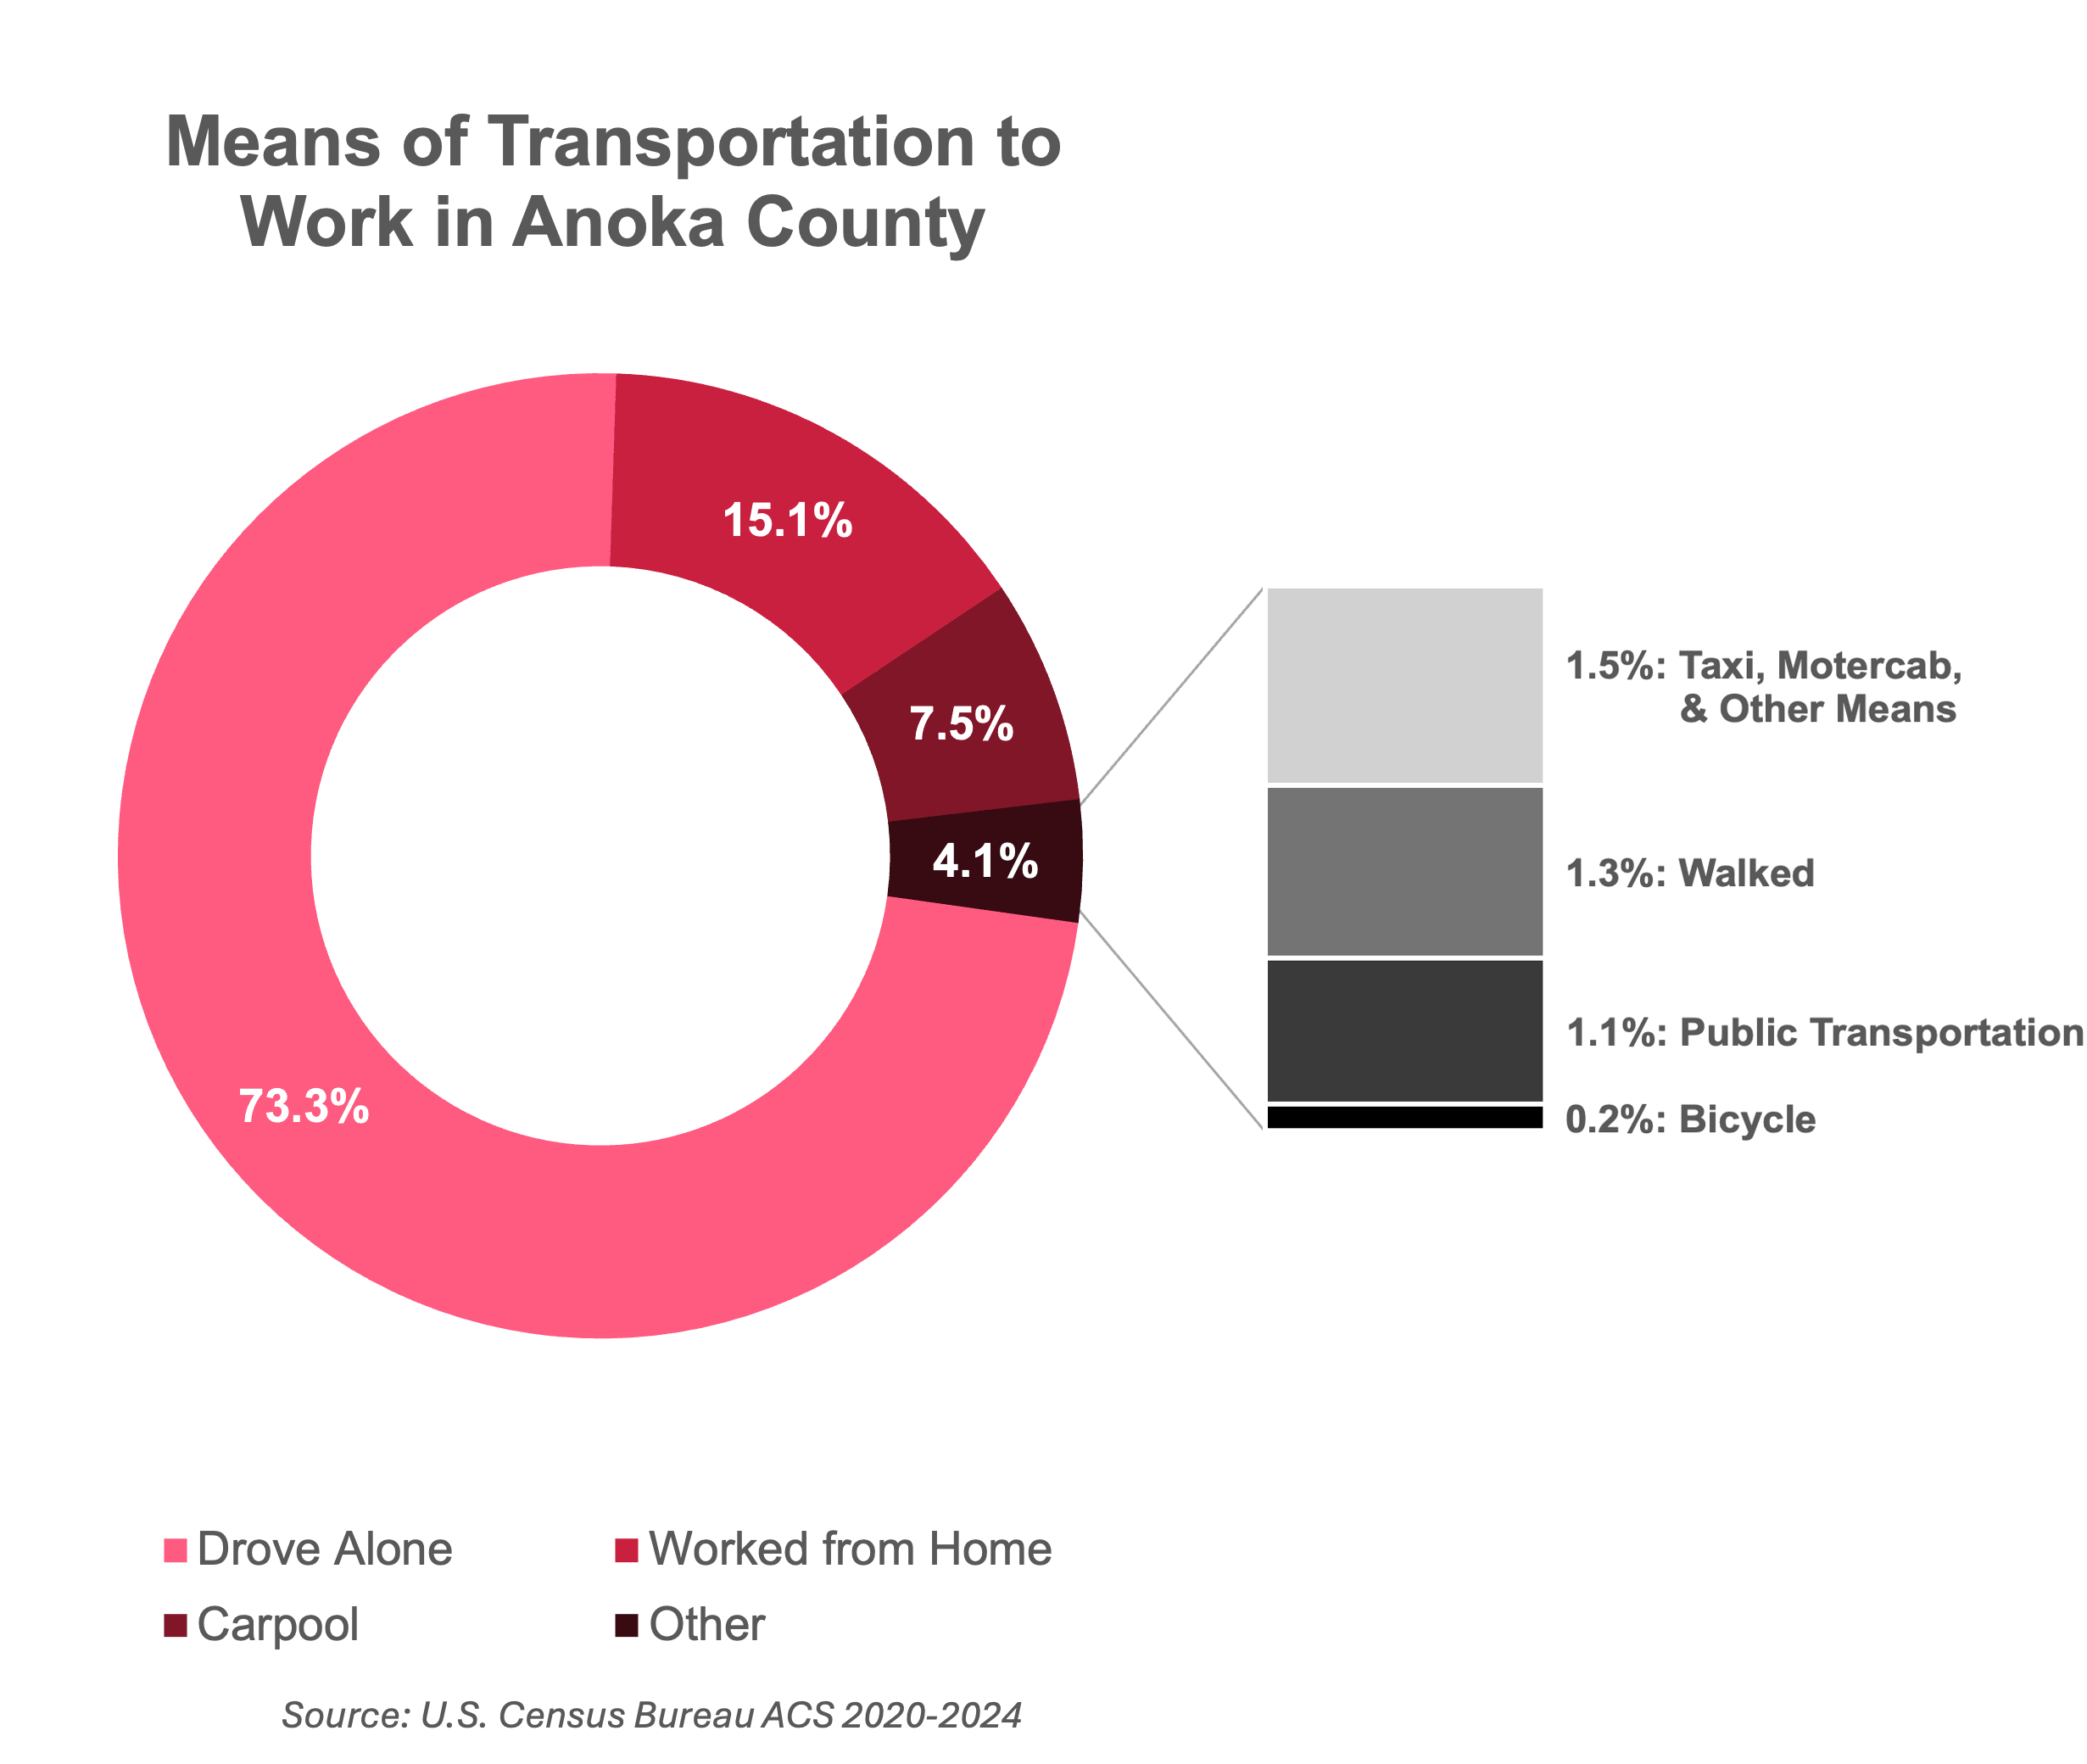
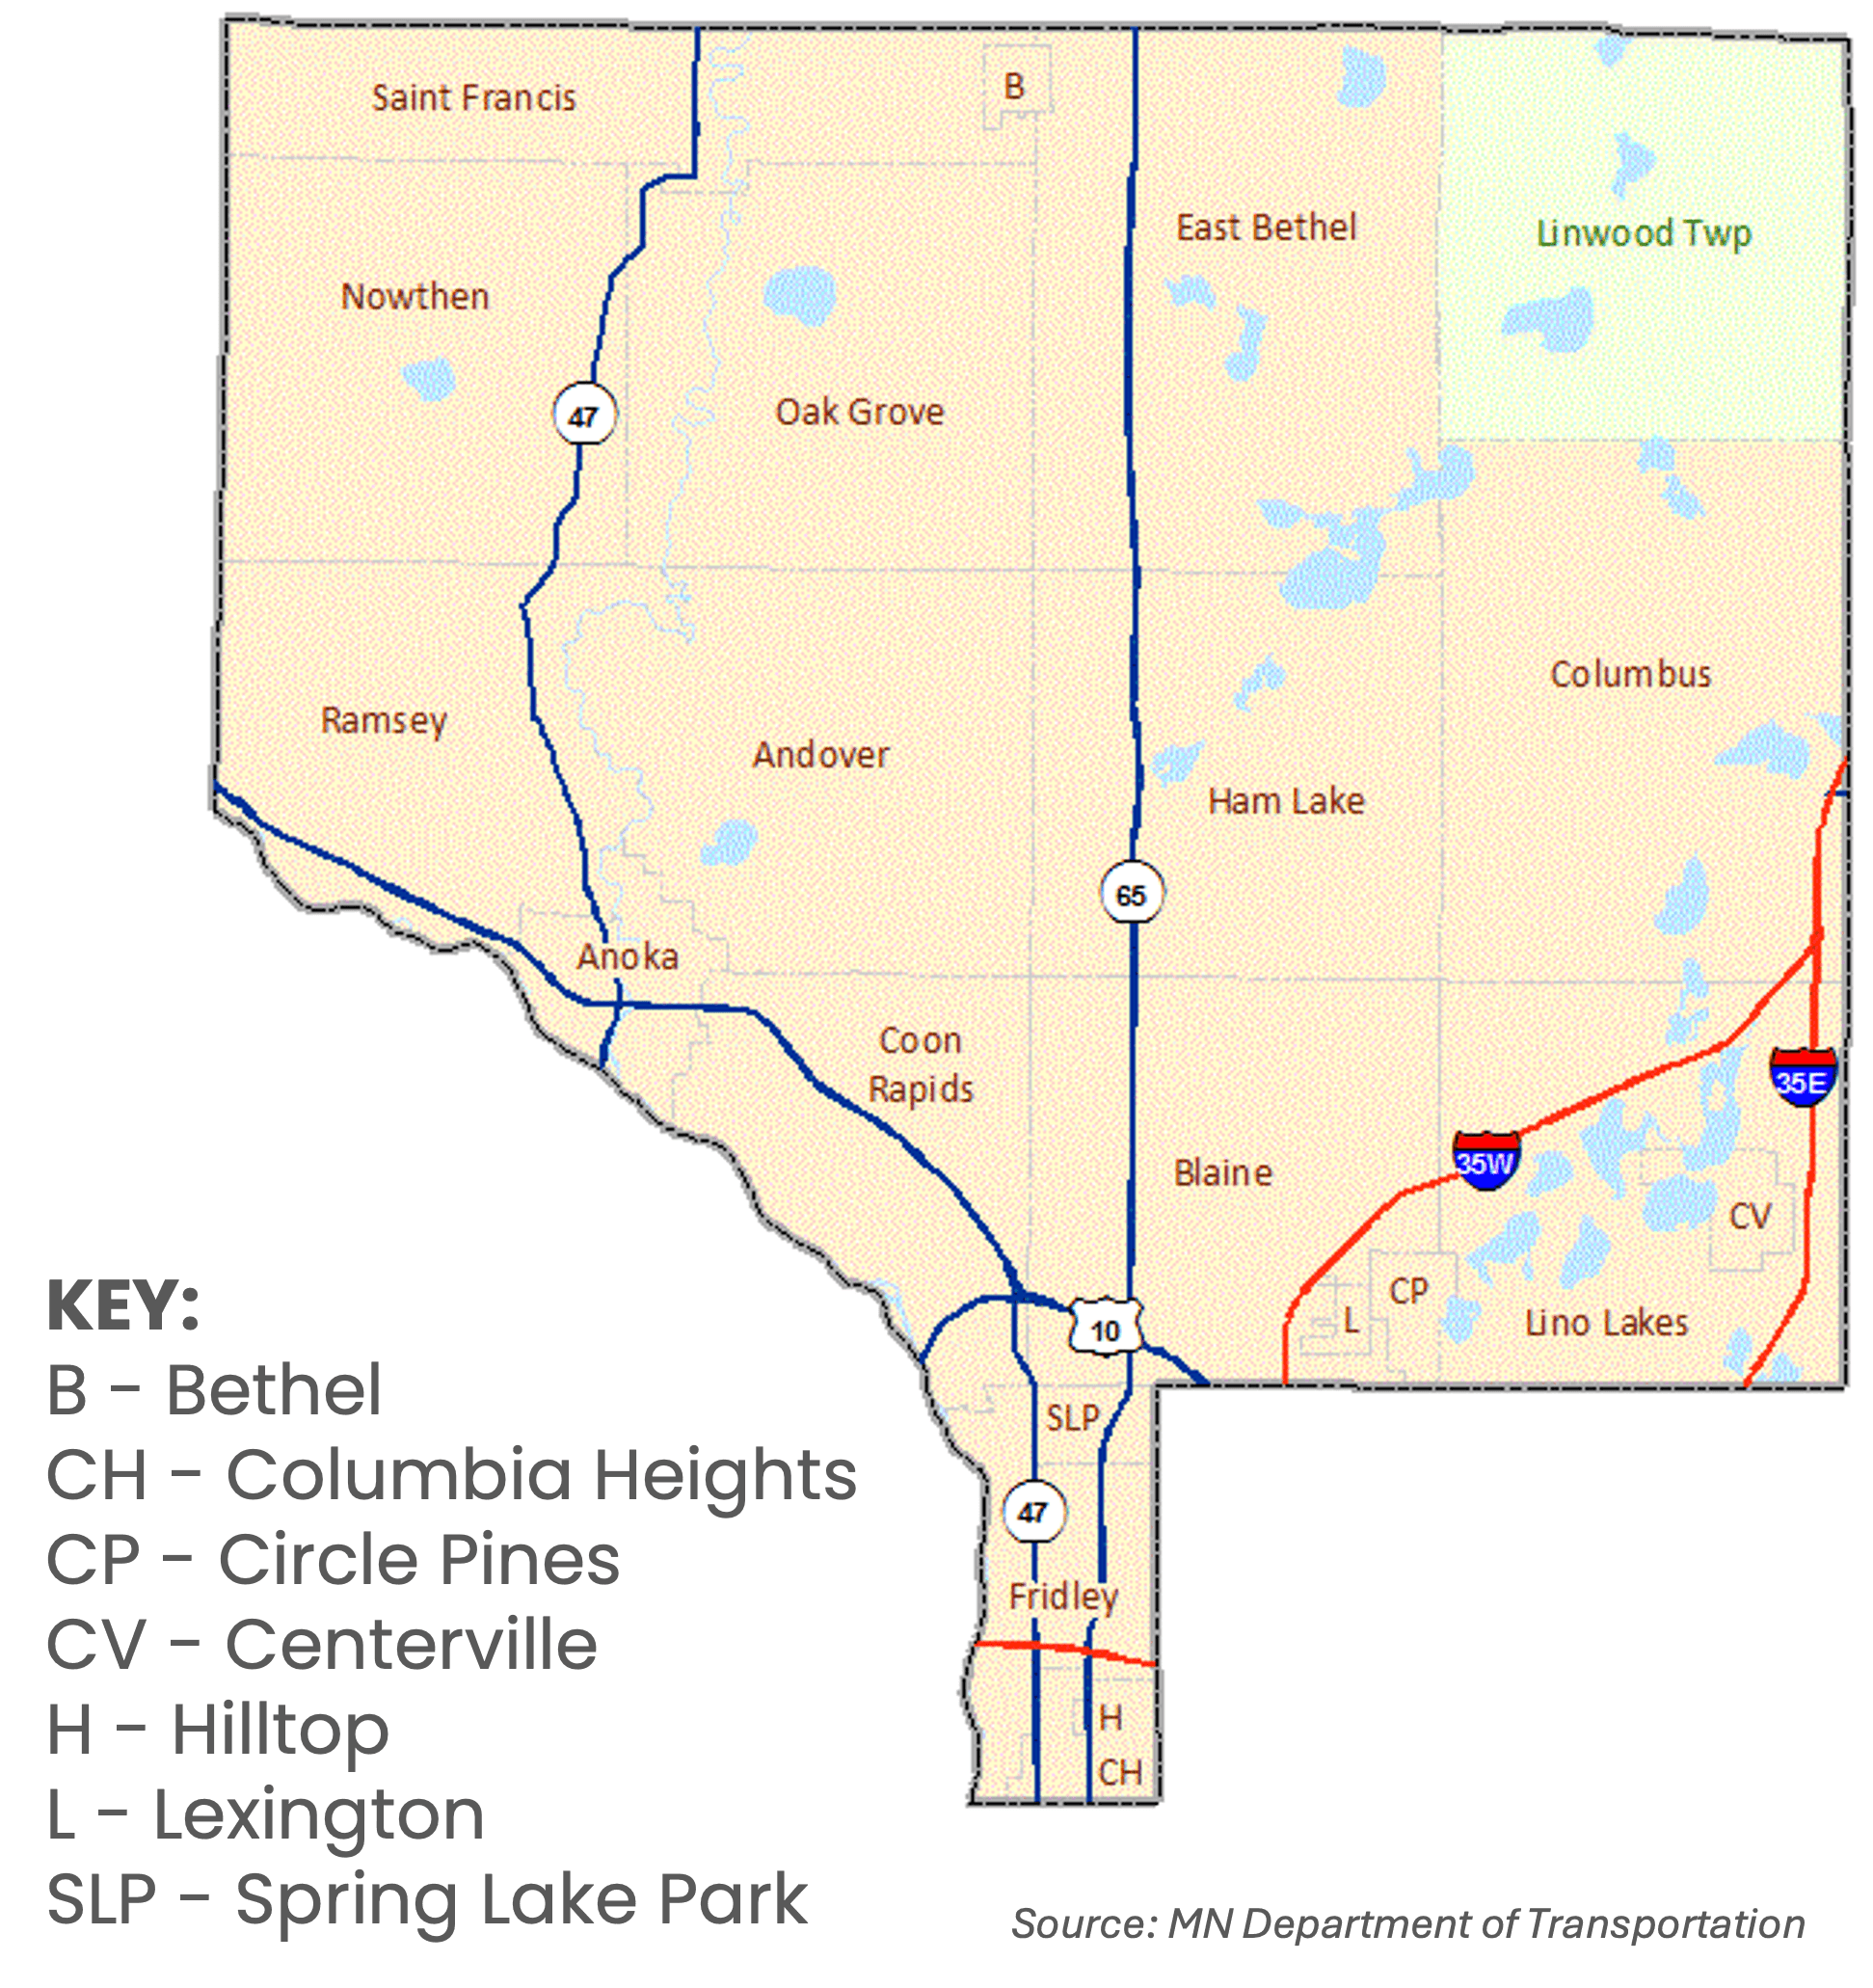
Over 80% of residents commute to work by car, utilizing Anoka County’s large 420+ roadway network and 6 major highways, while about 1% use public transportation, which includes the county’s 9 public bus fixed routes and 1 train line.
Business Conditions Survey
Brief Summary
Background
The MetroNorth Business Conditions Survey was designed to capture the business trends of the North Metro community, with responses published anonymously in this dashboard. Despite not being fully representative of the North Metro region, the survey’s 51 chamber member responses provide useful insight into local business conditions.
Results
Most respondents are not hiring, with 60% reporting zero job openings and 29% reporting 1-5 job openings. Respondents reported difficulties in finding qualified employees with the skills and experience required for their job openings. 60% of respondents selected Labor and 49% selected Materials as one of their top two costs that have increased most significantly over the past year. Compared to one year ago, 39% of respondents reported an increase in their business’s financial performance, 37% reported a similar performance, and 23% reported a decrease. Over half of the respondents selected Operating Costs (54%) as one of their top challenges, followed by Labor (37%). Regarding the overall North Metro business climate, 25% view current conditions as improving, 17% as declining, 35% as stable, and 21% as unsure.
Key Takeaways
The patterns suggest that despite low hiring demand, finding talent remains a major challenge for businesses in the North Metro region. These responses also highlight the cost pressures facing businesses, with labor and materials being the major areas of rising costs. Additionally, there appears to be an overlap in significant economic challenges facing North Metro businesses, even as most respondents’ businesses are either in an improved or similar financial performance position compared to one year ago. Lastly, North Metro business leaders have mixed views of the current local business climate, as there is no clear consensus on its direction.
Appendix